Consumer understanding and awareness of the concept of ultra-processed foods
In this guide
In this guideThe scale of media attention to UPFs and internet activity on the subject suggests considerable and increasing interest in these foods. For example, Figure 2 reports the results of a Google Trends analysis of UK search activity on this search engine over the period January 2019 to September 2024. Compared with genetically modified organisms (GMOs) and organic food (as example issues that are of interest/concern to consumers), there was less search activity with respect to UPFs until early-2023. Since that time, however, the intensity of searches on UPFs increased considerably and, since the start of 2024, the number of searches on UPF have consistently exceeded those for GMOs and organic food.
Figure 2. UK Google global searches for term UPF, organic food and GMO, January 2019-September 2024
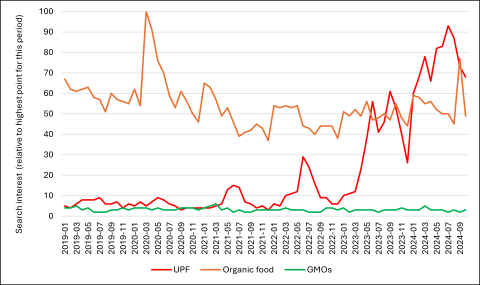
Source: Google Trends analysis – UK (17th October 2024). Note: numbers represent search interest relative to the highest point for the period January 2019 to September 2024. A value of 100 is the peak popularity for the term. A value of 50 means that the term is half as popular. A score of 0 means there was not enough data for this term.
The international literature suggests a high level of consumer awareness of the term ‘UPF’. The largest number of studies relate to Brazil and other parts of Latin America. For example, in one study by Sarmiento-Santos et al. (2022), 82% of respondents declared that they were aware of the term UPF. Likewise, in a Uruguayan study, 91% of respondents could provide at least a basic explanation of UPF (Ares et al., 2016). In other countries, a lower level of awareness of UPF has been recorded, for example 77% of respondents were familiar with the term in a Spanish study (Pedro-Botet et al., 2022), whilst 55% of respondents had heard of the term in a study in Vermont in the United States (Rose et al., 2023).
With respect to the UK, there is a paucity of studies on consumer awareness of UPFs. One study that addressed awareness directly is from IGD (2023). In this survey, 34% had neither seen nor heard of UPFs, while 26% had seen or heard of UPFs but were unsure what they were. The remaining 40% had seen or heard of UPFs and claimed broadly to know what UPFs were. In a recent study (Robinson et al., 2024), 73% of respondents had heard of UPFs and 57% reported that they knew what UPFs were. Participants with a higher income and/or education level were more likely to report being aware of UPFs.
Previous studies suggest a relatively weak relationship between awareness of UPFs and a broadly correct understanding of what this term means. For example, in the Brazilian study by Sarmiento-Santos et al. (2022), there was only a modest correlation (0.533) between respondents declaring awareness of UPFs and being able to demonstrate a correct understanding of the term. In a Canadian study in the province of Quebec, whilst 86% of respondents had heard of UPFs, only 17% had both heard of the term and declared that they knew well what it meant (Saulais et al., 2023).
Factors influencing consumer understanding of UPFs
Across the various studies that explore consumer understanding of UPFs, several key factors can be identified as determinants of consumer understanding. Each is described in turn below.
Level of processing
A dominant theme in studies of consumer understanding of UPFs relates to broad ideas around level of processing and being a product of the food industry. For example, in the Brazilian study by Sarmiento-Santos et al. (2022), 78% of respondents indicated that their best definition related to the number of processes by the food industry a product had been subject to. Likewise, in the study by Ares et al. (2016), the concept of UPFs was strongly associated with the degree of industrial processing, with the most frequent descriptors being ‘highly processed’, ‘processed more than once’ and ‘industrial products.’ In a study of Swiss consumers (Hassig et al., 2023), UPFs were broadly associated with the concept of ‘foods produced by food industry.’ Finally, the most frequent association with UPFs in the Bolhuis et al. (2022) study in the Netherlands, Italy and Brazil was food products subject to a series of industrial processes.
Of importance here is the linkage between level of processing and the fact that this processing has been undertaken by food businesses, and a distinction is made between processing by industry and being ‘home-made’. Thus, products that have been subject to multiple processes are seen as distinct from those that are industrially produced if they are not the product of the food sector, suggesting that being home-made has a mitigating effect on the level of processing (Devia et al., 2021). Furthermore, the degree of industrial processing is often used as a heuristic for the perceived naturalness of a food (Roman et al., 2017).[1] Thus, in the study by Ares et al. (2016), a common defining characteristic of UPFs was ‘not home-made'. In a recent Brazilian study, “healthy food” is widely associated with “unprocessed foods” (Santos et al., 2024).
Number and type of ingredients
A second major theme in the literature on consumer understanding of UPFs relates to the number of ingredients in a food, and the notion that ‘things have been added’ to a food. More specifically, the addition of ‘artificial’ additives/chemicals. For example, in the Aguirre et al. (2019) study of younger adults in Argentina and Ecuador, UPF was strongly associated with the presence of artificial ingredients and additives. There was, however, a significant difference between respondents in the two countries; whilst 40% of respondents made references to artificial ingredients in Ecuador, only 7% of respondents did so in Argentina. In the Bolhuis et al. (2022) study in the Netherlands, Italy and Brazil, UPF was widely associated with food products that contain artificial ingredients. Likewise, in the study by Ares et al. (2016), defining characteristics of UPF included ‘additives’, ‘chemical products’, ‘artificial ingredients’ or ‘non-natural ingredients.’ Indeed, Machin et al. (2022) suggests that certain ingredients (for example, high fructose corn syrup or additives) are used by consumers as simple cues to indicate ‘unhealthiness’.
Nutritional composition
A third theme relates to the nutritional composition of UPFs, and especially the level of sugar, fat, salt, and/or sodium. For example, in the study by Sarmiento-Santos et al. (2022), 88% of respondents related UPFs to high levels of sugar, fat and salt, and to low nutritional quality overall. This theme relates to the broader understanding of UPFs as being ‘unhealthy’ or ‘less healthy.’ In part this phenomenon relates to the more general observation that consumers tend to judge more highly processed foods to be less healthy than foods that are less processed (Evans et al., 2010), although there does appear to be an additional ‘stigmatising’ effect of seeing a food product as a UPF with respect to being seen as highly processed and unhealthy (Hassig et al., 2023). The literature does suggest, however, that there is appreciable variation in the degree to which UPF is defined as unhealthy. Thus, whilst 28% of respondents from Ecuador characterised UPF as unhealthy in the study by Aguirre et al. (2019), only 9% of Argentinian respondents in the same study made this link.
Importantly, however, various studies have shown that whilst UPF as a broad concept is associated with ‘unhealthy’ foods, certain products in this category may not be so characterised. Thus, the fact that a food belongs to a certain food type (for example, dairy products versus snacks) may be sufficient for a UPF (for example, sweetened yogurt versus crisps) to be judged as either ‘healthy’ or ‘unhealthy’ (Machin et al., 2020). Likewise, UPFs containing ingredients that are judged to be more ‘natural’ (such as organic ingredients) can, conversely, be judged to be healthy. Visual cues associated with the product, for example package design, price, brand and labels can also mitigate perceptions that more heavily processed foods such as UPFs are ‘unhealthy’ (Machin et al., 2020).
Consumer understanding of the classification of ultra-processed foods
The concept of UPFs lies within a broader categorisation of foods according to the level of processing and/or the ingredients they contain. The NOVA classification is outlined above as an example (Figure 1). Many studies on consumer understanding of UPFs explore the degree to which consumers can distinguish between foods according to the defining dimensions of this classification, and correctly allocate specific foods to particular categories, including UPFs (see for example, Sarimento-Santos et al., 2022; Bolhuis et al., 2022; Hassig et al., 2023; EiT Food Consumer Observatory, 2024).
A more general literature outlines the ways in which consumers categorise foods, using multi-level and context-specific indicators and cues (Blake, 2008; Furst et al., 2000). According to Furst et al. (2000), a common delineating factor is the distinction between ‘fresh’ and ‘processed’, with the notion of fresh often being employed to distinguish foods that have not been processed, have been processed in ways that are deemed to be ‘natural’, and/or foods that are home-made. Indeed, fresh foods are frequently distinguished from foods that are seen as commercially or industrially processed.
Across studies in numerous countries the general finding is that consumers are unaware of classifications of foods according to level of processing, and especially the NOVA classification, but more familiar with the term UPF. For example, the majority of respondents were unaware of the NOVA classification in the Netherlands (84%), Italy (75%) and even Brazil (58%) where the NOVA classification was developed and first applied (Bolhuis et al., 2022). Further, when presented with the NOVA classification, consumers struggle accurately to allocate foods within this classification and often find it difficult to identify foods that are UPFs from those that are non-UPFs according to the NOVA classification. For example, 85% of respondents in one Brazilian study did not understand the NOVA classification, with an average rate of correct classification of only 42% (Monteiro et al., 2022). Likewise, in a Spanish study, less than nine out of 22 UPFs were correctly identified by at least 50% of respondents (Pedro-Botet et al., 2022).
The literature suggests that some foods are correctly identified as UPFs according to the NOVA classification on a frequent basis and across multiple countries. These include most frequently soft drinks and various processed meats (see for example, Ares et al., 2016; Aguirre et al., 2019; Basu et al. 2013a; Basu et al., 2013b; Monteiro et al., 2017; Sarmiento-Santos et al., 2022; Fondevila-Gascon et al. 2022; Rybak et al., 2024). Conversely, there is evidence of considerable uncertainty as to the classification of other foods, and whether they are UPFs, including milk and dairy products and bread (Ares et al., 2016; Aguirre et al., 2019; Sarmiento-Santos et al., 2022). For example, in the study by Sarmiento-Santos et al. (2022), 44% of respondents believed that unsweetened yoghurt was a UPF.
The EiT Food Consumer Observatory (2024) covered 17 European countries, including the UK, and examined the ability of respondents to allocate 16 food products between the four NOVA categories (Figure 3). Whilst respondents frequently mis-classified foods, over- or under-estimating the degree to which they are processed, the rate of correct classification varied significantly between individual food items. For example, whilst 61% of respondents correctly identified an energy drink as a UPF, vegetarian chicken pieces and chocolate were only identified as UPF by 36% and 22% of respondents respectively. Several foods were also incorrectly identified as UPF on a frequent basis, including potato crisps (44%), soy milk (22%) and cheese slices (16%).
Figure 3. Consumer categorisation of foods according to NOVA classification
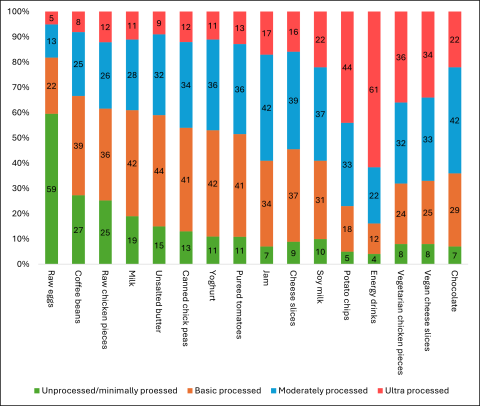
Source: EiT Food Consumer Observatory (2024). Proportion of consumers (%) categorising each food according to the 4 NOVA classifications. Note: In this figure the food items are ordered left to right from unprocessed/minimally processed (raw eggs, coffee beans, raw chicken pieces, milk), basic processed (unsalted butter, canned chick peas, yoghurt, pureed tomatoes), moderately processed (jam, cheese slices, soy milk, potato chips) to ultra-processed (energy drinks, vegetarian chicken pieces, vegan cheese slices, chocolate).
Related specifically to the UK, in the survey reported by IGD (2023), respondents were asked to classify 17 food products according to the NOVA classification. Of these products, nine were misclassified, including all but one of the UPFs. The misclassified UPFs included biscuits, frozen pizza, breakfast cereal, margarine, packaged bread, almond milk, and fruit yogurt. The level of processing of all these products was underestimated by respondents. Only soft drink was correctly categorised as a UPF.
In a further UK study (Robinson et al., 2024) participants were presented with 10 food items and asked whether each was a UPF. These food items included five UPFs and five non-UPFs according to the NOVA classification. The proportion of respondents correctly identifying the UPFs ranged from 35% (baby formulas) to 66% (burgers). The proportion correctly identifying non-UPFs ranged from 51% (smoked meats) to 82% (maple syrup).
There is some evidence that consumers use specific food processing operations and/or modes of food preparation as heuristics to identify UPFs (both correctly and incorrectly). These include, for example, frying or freezing, and the fact that foods are microwaveable. For example, in the study by Sarmiento-Santos et al. (2022), 74% of respondents incorrectly identified frozen potatoes and frozen broccoli as UPF according to the NOVA classification. Conversely, 84% correctly identified microwave noodles as a UPF in the study by Pedro-Botet et al. (2022).
At the same time, it is evident that certain food ingredients mitigate the frequency with which consumers classify foods as UPFs. These include ingredients that are plant-based and/or organic. Thus, for example, plant-based hamburgers were judged to have low levels of processing in the study by Rybak et al. (2024). As a further example, in the EiC Food Consumer Observatory (2023) survey, vegetarian chicken pieces and vegan cheese slices were only correctly identified as UPF by 36% and 34% of respondents, respectively (Figure 3).
Consumer differences in awareness and understanding of UPF
Across the limited number of studies of consumer understanding of the NOVA classification and/or UPF and the ability to correctly classify foods accordingly, minimal attention is given to variations across consumers according to socio-demographic or other variables. Amongst the few exceptions, in the Spanish study by Pedro-Botet et al. (2022), the rate of correctly classifying foods as UPF was greater amongst women, those aged 21 to 50 years and university students, and lower by those living in a family. Correctly identifying UPF was also positively associated with greater consumption of fruit (perhaps indicating greater concern about food and health?) and being familiar with the UPF concept and term.
In the recent UK study by Robinson et al. (2024), there was a greater propensity to correctly identify UPFs amongst certain consumer sub-groups, for example those with higher levels of education, females and older participants. These same groups, however, were also more likely to incorrectly classify non-UPFs, suggesting a tendency to classify more foods (both correctly and incorrectly) as UPFs.
[1] More generally, being ’home-made’ or ‘non-industrial’ is widely synonymous with being ‘natural’ (Devia et al., 2021).